
How to write startup financial projections
 Baltej Singh8 min read
Startup financial projections are a dated model of revenue, costs, cash, and runway with every driver labeled, not a hopeful chart pasted into a deck. Write them so a co-founder can recompute the next month without asking which burn definition you used. This post is an operating method for early US startups. It is not tax, audit, or fundraising legal advice.
What startup financial projections must answer
Before you open a template, write four answers in plain sentences. If any answer is missing, the model is decoration.
- Time box: Are you projecting 12, 24, or 36 months, and what is month zero (today's cash and headcount)?
- Revenue logic: What is sold, at what price, at what volume path, and which lines are recurring versus one-off?
- Cost logic: Which costs scale with headcount, which are fixed, and which are one-time (migration, legal, launch)?
- Cash truth: Starting cash, when receivables actually clear, and whether burn is gross or net every time you say "runway."
Startup financial projections fail when those four answers live only in the founder's head. They also fail when the deck shows a hockey stick while the operating spreadsheet still has last quarter's contractor list. Treat the written answers as the source of truth; the chart is a view.
This is different from a weekly budget one-pager (owners and categories for Monday spend) and different from burn-rate arithmetic alone. For the pure burn and runway formulas investors expect, see How to calculate startup burn rate and runway. Here the job is to build the projection pack those formulas sit inside.
Assumption ledger (the real artifact)
Create one table of drivers before you format a P&L. Every row needs an owner and an as-of date. If a row cannot name a source, it does not enter the model.
Driver | Unit | Base case | Stress case | Owner | As-of |
|---|---|---|---|---|---|
Starting cash | USD | Bank balance today | Bank minus 10% buffer | Finance lead | Statement date |
Paid seats or orders | per month | Conservative ramp | Flat for 3 months then ramp | Sales or founder | CRM export date |
Average price | USD | Current list or contract | Price down 15% | Founder | Price sheet date |
Gross margin | % | Measured COGS | Margin minus 5 pts | Ops | Last close |
Headcount plan | people by month | Hiring plan v1 | Slip every hire 1 month | Founder | Board note date |
Payroll fully loaded | USD per role | Offer + taxes + tools | Plus 10% | People lead | Offer letters |
Fixed opex | USD per month | Rent, core SaaS | Plus one new tool | Ops | Expense export |
One-time spends | USD in month N | Legal, migrate, launch | Same plus delay risk | Founder | Quote dates |
Burn definition | gross or net | Named explicitly | Same definition | Finance lead | Model cover |
Raise or revenue cliff | month | Optional | Slip 3 months | Founder | Pipeline date |
Print or pin that ledger above the model. When someone changes paid seats, they change the ledger first, then the sheet. Silent cell edits without a ledger line are how two cofounders disagree in a partner meeting.
Label gross burn as total cash out before revenue. Label net burn as cash out minus cash in for the period. Never mix them in one runway sentence. The burn post above walks the math; your projection cover sheet must name which definition the runway uses.
Three scenarios before any chart
Build three complete cases that share the same ledger structure, not three pretty themes on one optimistic path.
Base: The path you would operate on if nothing exciting happens. Hiring only for roles you can fund from current cash plus contracted revenue.
Hire-later: Same revenue path, every net-new hire slips one month. Use this when recruiting is uncertain. It usually shows more runway and slower delivery. Put that tradeoff in words under the chart.
Raise-or-pipeline slips: Keep the hire plan, push the external cash event (raise close, enterprise invoice, launch) by three months. If runway collapses, the model did its job. Cut spend in the model on purpose rather than hoping the chart lies.
Do not present a fourth "upside" case to investors until base and slip cases are boringly documented. Upside without a slip case reads as marketing. Upside after two honest stresses reads as judgment.
For each scenario, compute ending cash by month and runway at today's burn definition. If month-six cash goes negative in base, fix the operating plan before you export PDF. A red cell is cheaper than a surprise payroll week.
Name the decision each scenario is allowed to trigger. Example rules: if raise-slips runway falls under four months, freeze non-customer travel and delay the AE hire; if hire-later still funds the roadmap, keep the slip and tell the board why delivery moved. Write those rules under the charts so the model drives choices instead of decorating a hope.
Build the model in Nautis Financial Planner
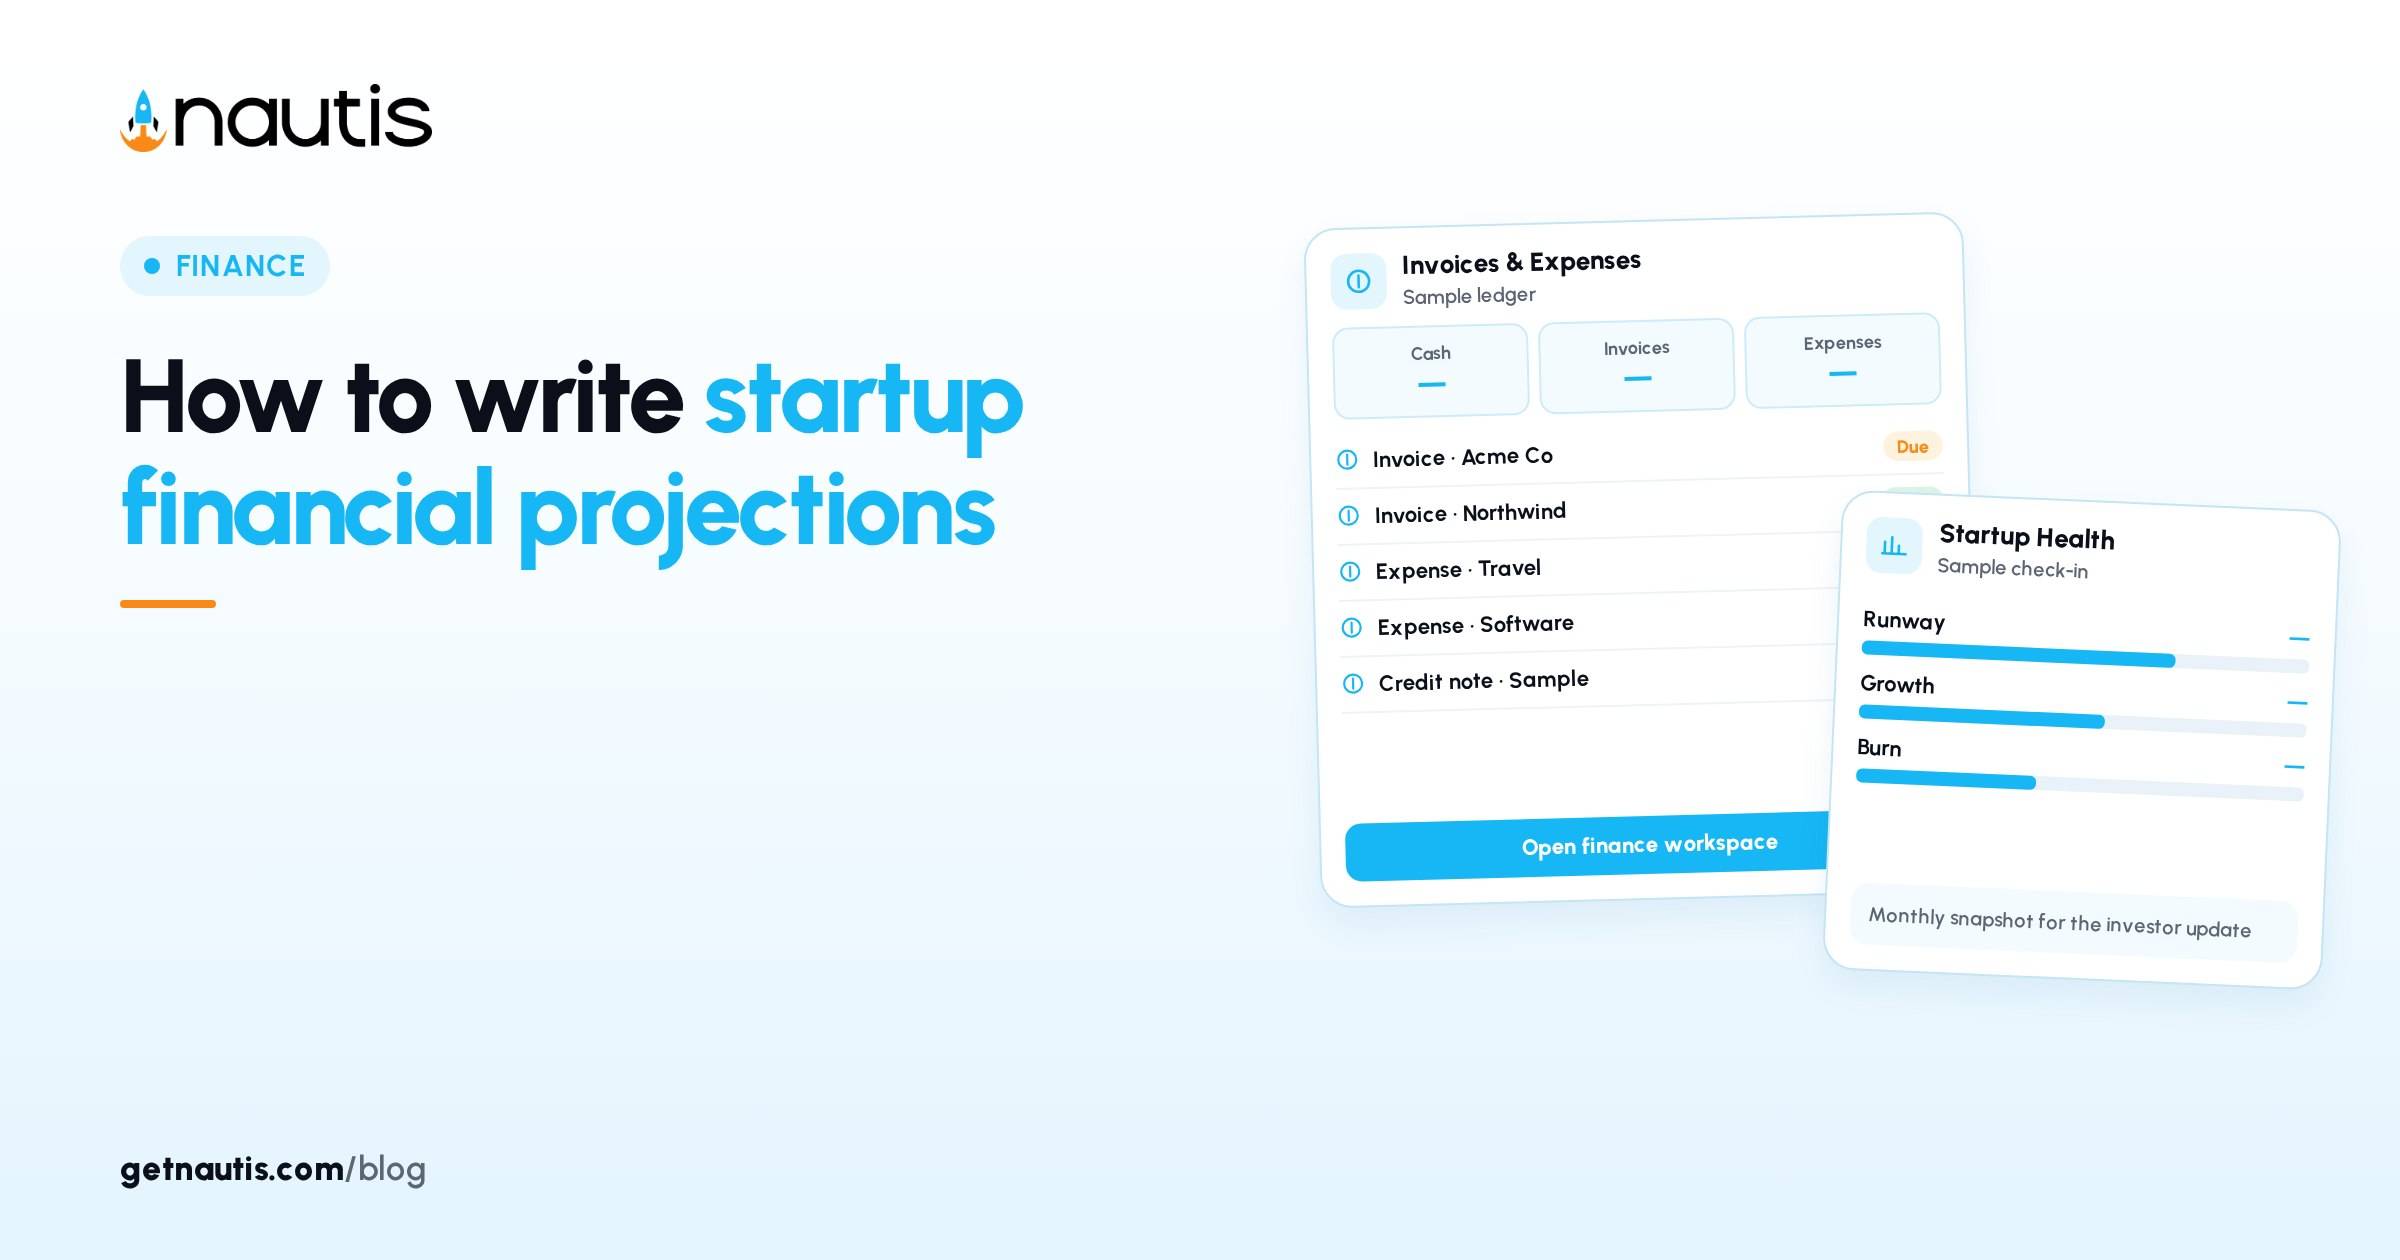
Financial Planner (checked 31 Oct 2026) builds a multi-year financial projection: revenue, costs, profit and loss, balance sheet, cash flow, and loan schedules. You enter assumptions once; Nautis renders statements, ratios, and a dashboard with burn rate and runway. Export to Excel or PDF when you are ready to share. Creating and editing projections needs create or update permission and a verified email. The module must be enabled on your plan.
From the sidebar, open Fundraising and click Financial Planner. Click New Project. Choose Blank Project or an industry template (for example SaaS, E-commerce, Restaurant, Services, Mobile App). Templates pre-fill revenue items, common cost categories, and assumptions for that model. Fill Project Name, optional Description, Projection Period (3-Year or 5-Year Plan), Currency, and Shared Access for teammates who may edit. Click Create Project.
Work the tabs in help order. On Revenue Items, add each product or service with name, unit price, billing frequency (one-off, monthly, quarterly, annual), forecasted units, and COGS per unit when it applies. On Model Inputs, add operating expenses (salaries, rent, software, marketing), non-operating income, other taxes, and non-recurring expenses. Match each line to a ledger row so Shared Access editors cannot invent silent drivers.
When the dashboard burn and runway disagree with your ledger definition, stop and reconcile. Do not export until the cover sentence states gross or net. Keep the assumption ledger in Notes or Sheets linked from the project description so the PDF is never the only copy of the logic.
Share Access only with people who may edit drivers. Read-only viewers can take a PDF. Mixed edit rights without a ledger owner produce silent optimistic ramps the night before a partner meeting.
Expenses stay the system of record for actual spend. Log costs in Expenses (checked 31 Oct 2026) with categories and receipts, then update projection cost lines when the monthly close shows a durable change. Projections that ignore the expense export drift within one quarter.
Illustrative pre-seed pack (composite only)
The numbers below are an illustrative composite, not a real company and not advice.
Illustrative starting point: $420,000 cash, $18,000 MRR, three people, gross burn about $55,000 per month, net burn about $37,000. Base case adds one engineer in month 4 and one AE in month 7, grows paid seats 8 percent month over month after month 2, and assumes no raise. Hire-later slips both hires one month. Raise-slips keeps hires and pushes a $1.5M close from month 9 to month 12.
Illustrative outputs a diligence reader should see: a one-page ledger, three cash charts with the same axes, a sentence that runway uses net burn, and a note that month-eight cash in raise-slips forces a hiring freeze unless revenue beats base by a stated amount. The illustrative lesson is the packet shape, not the dollar levels. Copy the shape; do not copy the numbers into your deck.
Illustrative failure mode: a founder exports a 5-year SaaS template, leaves template marketing spend untouched, and presents year-three margin as proof. Verified process is the opposite: delete template lines you cannot own, then add only ledger-backed drivers.
Keep the pack live with Startup Health
Projections rot when actuals never update them. Startup Health (checked 31 Oct 2026) is a monthly check-in for cash, recurring revenue, and burn in under a minute. Nautis turns those three numbers into runway, growth, and burn-trend metrics, charts, alerts, and an investor snapshot you can share. Enter Cash Balance (month-end bank), Monthly MRR (recurring only; skip one-off sales), and Monthly Burn (total spend minus revenue; enter 0 if cash-flow positive). Save and update the dashboard, then reconcile any large gap against the Financial Planner scenario you called base.
Recompute the projection when headcount changes, when a major spend lands, or when the raise calendar moves. Say whether burn is gross or net in the same sentence as runway every time. Review the ledger on a fixed monthly cadence after the Startup Health check-in, not only the week before a board meeting.
If alerts show runway under six months or burn jumping versus last month, open the slip scenario the same day. Either cut a cost line with an owner and date, or rewrite the hire plan. Leaving the alert up while the deck still shows the old base case is how trust dies in diligence.
Startup financial projections earn their keep when the ledger, the Planner project, and the latest Startup Health check-in tell the same story within a stated tolerance. When they diverge, fix the data path before you polish the narrative in the investor snapshot. The model is a control system. The chart is only the display.
Frequently asked questions
What belongs in startup financial projections?
A dated revenue and cost model with labeled drivers, clear gross or net burn, ending cash by month, and at least one stress case. Charts without that ledger are not enough.
How is this different from burn rate math?
Burn and runway formulas measure the current path. Projections assemble the drivers and scenarios those formulas sit inside across many months.
Where do I build them in Nautis?
Use Financial Planner under Fundraising for the multi-year model, Expenses for actual spend, and Startup Health for the monthly cash, MRR, and burn check-in.
How often should I refresh the model?
After each Startup Health check-in, and immediately when headcount, major spend, or raise timing changes. Say whether burn is gross or net every time you quote runway.
Sources
- Nautis Financial Planner help. Checked on October 31, 2026.
- Nautis Startup Health help. Checked on October 31, 2026.
- Nautis Expenses help. Checked on October 31, 2026.
- How to calculate startup burn rate and runway. Checked on October 31, 2026.
Baltej Singh is a serial entrepreneur, technology leader, and Founder & CEO of Nautis and DemoVexa, with over 16 years of experience building software products, SaaS platforms, and startups. Previously the Co-Founder & CTO of SanchiConnect, he has worked extensively in the DeepTech startup ecosystem, connecting with 200+ venture capital firms and supporting a network of 4,000+ startups. Passionate about AI, automation, and entrepreneurship, he focuses on building innovative products that solve real-world problems and help businesses grow.