
Startup metrics dashboard: what to track first
 Baltej Singh9 min read
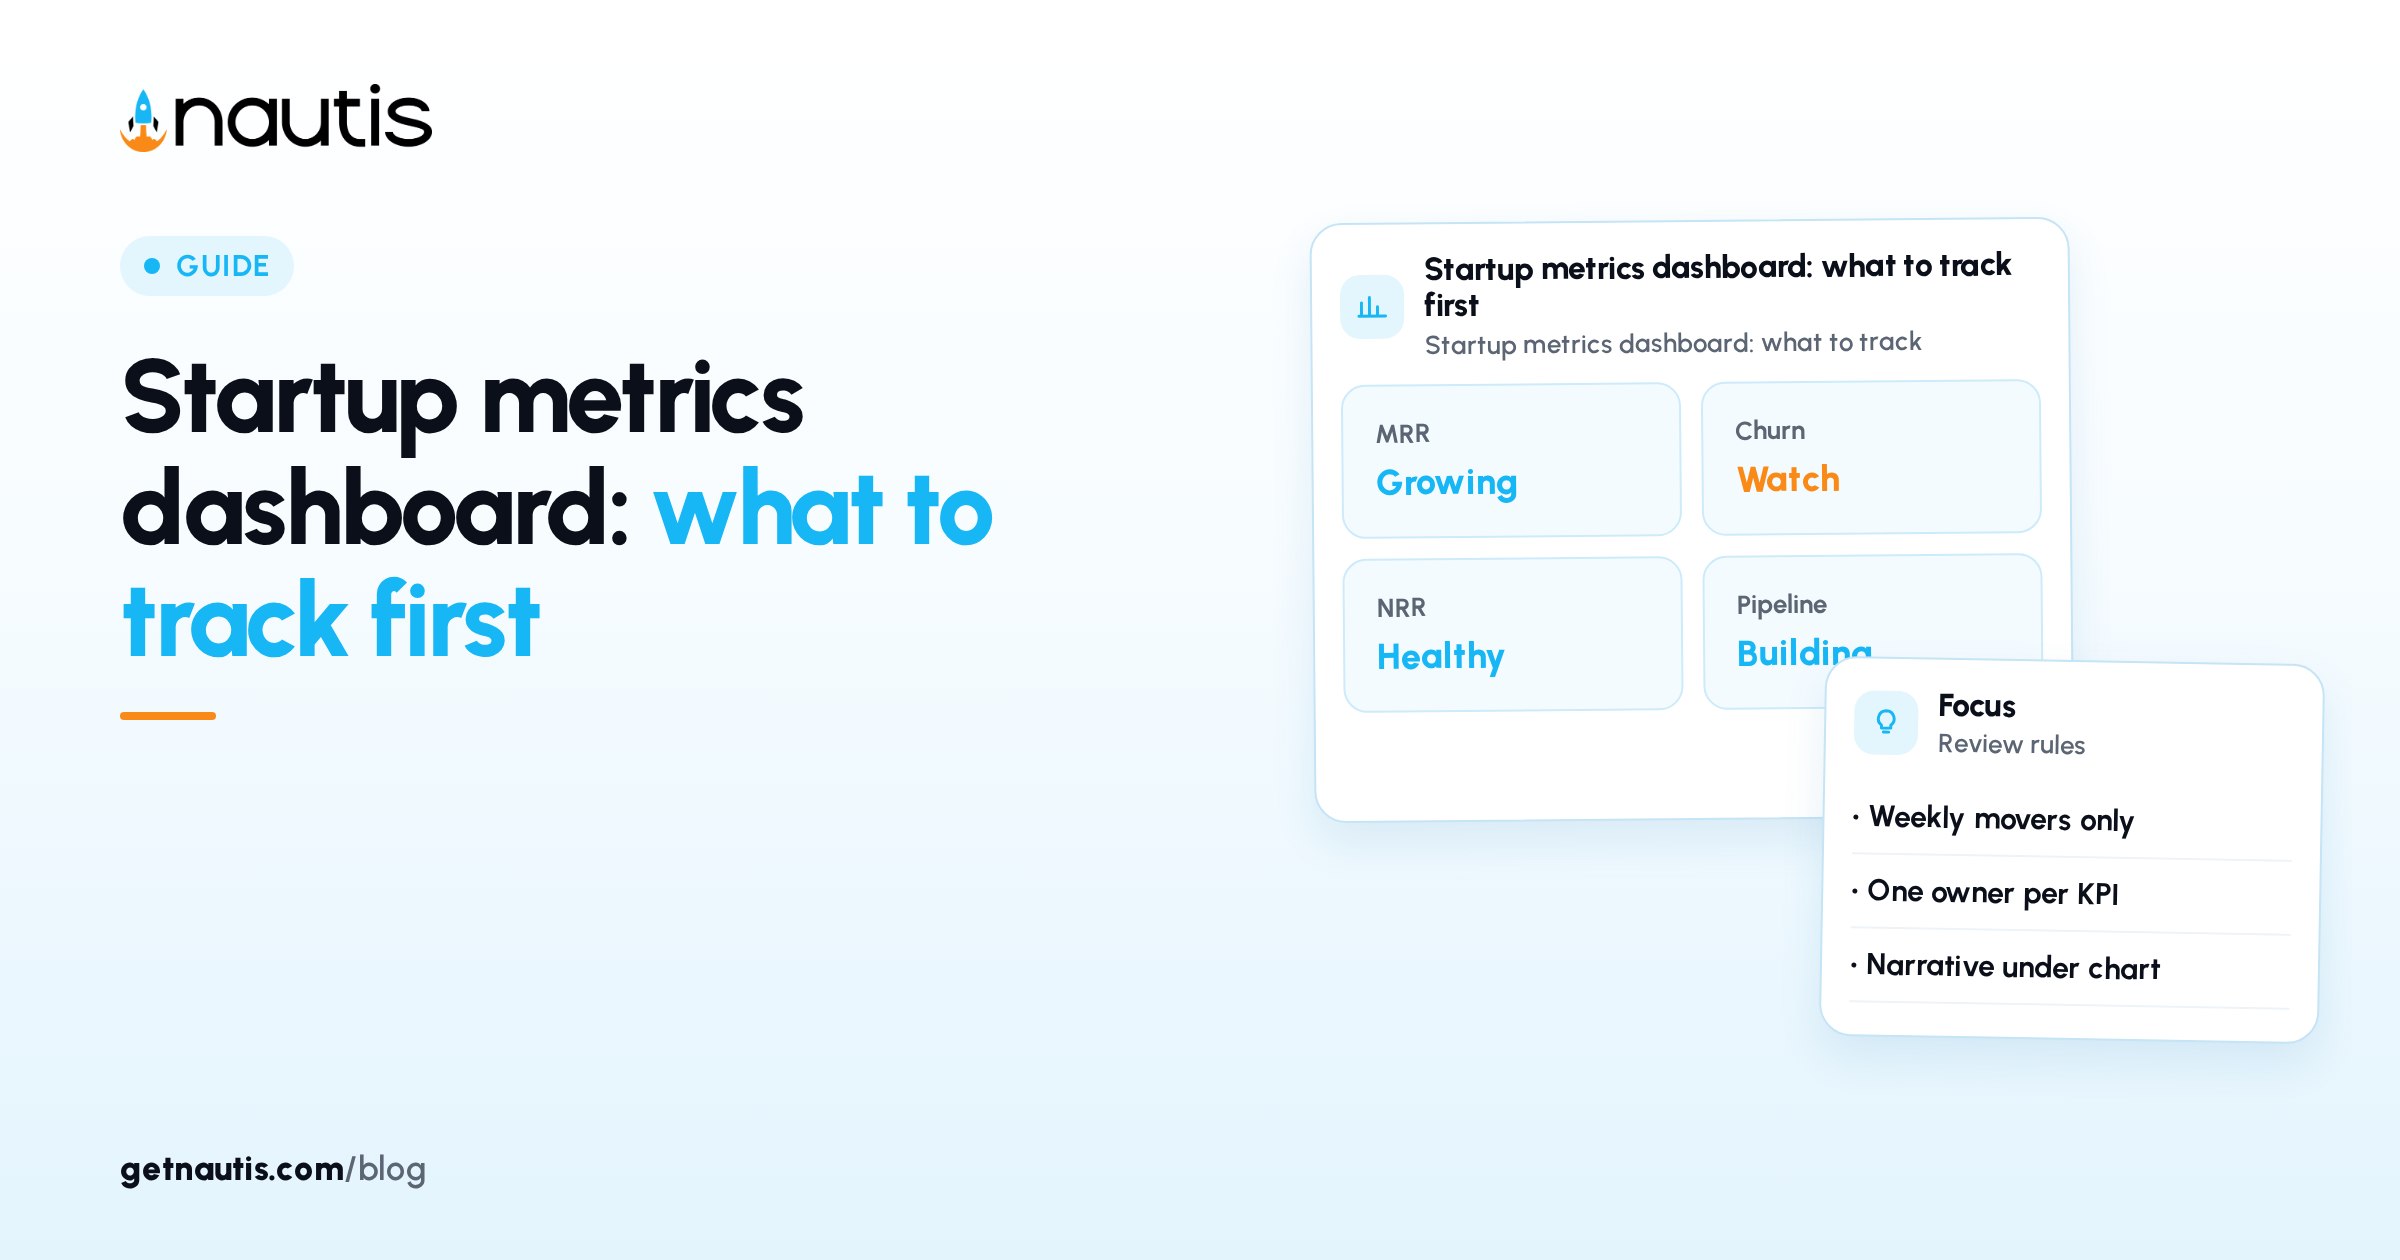
Startup metrics dashboard basics for early usage analytics are a short list of usage and outcome numbers with written definitions, a named updater for each, and a fixed order for reading them on a fixed Monday slot. The page fails when tiles are decorative, when two people use different event names for the same label, or when nobody opens the board after it is built. Start with a handful of usage metrics. Add finance tiles only if they change a shipping decision the same week.
Startup metrics dashboard basics begin with definitions
For every metric, write four fields before you plot anything:
Field | What to write |
|---|---|
Name | The label you will say aloud in a meeting |
Formula | Events, filters, and time window |
Source | Product analytics, warehouse, or a dated manual count |
Updater | One person who refreshes it on a stated day |
Example row:
| Name | Activated workspaces | | Formula | Workspaces that completed the core workflow event within 7 days of signup | | Source | Product analytics event core_workflow_completed | | Updater | Product lead, every Monday |
If a pair of teammates cannot agree on the event list in five minutes, the metric is not ready for the board.
Pick product numbers that force decisions
A practical first set for a young SaaS app:
Read order | Metric | Decision it supports |
|---|---|---|
1 | New signups (qualified) | Whether top-of-funnel is alive |
2 | Activation rate | Whether new accounts reach first value |
3 | Core-active accounts on the core workflow | Whether the product is being used for the job you sell |
4 | Retention for a simple signup cohort | Whether value sticks past week one |
5 | One friction count (errors, support tags, or abandoned setups) | Where to aim fixes |
Qualified signups means you exclude obvious spam and internal test accounts in the formula. Write that exclusion down.
Avoid a dozen funnels on day one. Depth comes after trust.
YC's essential startup advice keeps returning to talking with users and watching real progress. A usage board supports that when the events match workflows people actually finish.
Monday read order beats a wall of charts
Read in this order each Monday review, even if the layout scatters tiles:
- Qualified signups
- Activation rate
- Core-active on core workflow
- Early retention
- Friction count
Stop when a tripwire fires. Example tripwires you invent for your own baseline (not industry benchmarks): activation down sharply versus your prior weeks with enough volume to care, friction count doubled after a release, retention cohort collapsing versus your prior cohort.
Write tripwires beside the definitions. A board without tripwires becomes wallpaper.
Store the definition table in Sheets so formulas are not trapped in one person's head.
How this board relates to cash views
Founders still need cash, burn, and runway. Keep those on the money review you already run, such as checks in Startup Health or plans in Financial planner. Do not duplicate three finance formulas onto the usage board unless a product change is the cause of a cash swing you are investigating that week.
If expense spikes matter to product reliability, pull detail from Expenses in the money review, not as vanity tiles on the usage page.
Activation without fake precision
Signup quality filters
Raw registrations include bots, tire-kickers, and duplicate emails. Decide what "qualified" means: verified email, non-disposable domain, or completed profile fields you already require. Apply the same filter to the activation denominator so rates stay comparable week to week.
Release windows on the chart
If you ship a large change, mark the date on the weekly note. Otherwise every dip looks like mysterious demand failure. A a short release marker saves hours of archaeology.
Segment only after the base rate is trusted
Segmenting activation by plan or channel is useful and also a way to hide a weak overall rate. Earn the right to segment after the blended activation number is stable and believed. Then add at most a single segment cut to the Monday page.
Activation should name the moment a user got the job done, not "clicked around." Prefer a single primary activation event. Secondary events can live in a deeper analytics project.
Weak activation | Stronger activation |
|---|---|
Signed up | Created the first live project and invited a teammate |
Logged in twice | Exported or sent the artifact the product exists to produce |
Opened settings | Connected the system of record the workflow needs |
Count activation in a fixed window (often seven days). Report sample size beside the rate. Tiny denominators lie.
Core workflow naming
Write the core workflow in user language users would recognize: "send first invoice," "publish first form," "close first deal in the board." Internal codenames on a founder dashboard create translation tax every Monday.
Multiplayer products
If value requires a second seat, activation may correctly include an invite-accepted event. Say so in the formula. Do not silently mix single-player and multiplayer activation in one tile.
Retention with small n
Early retention charts swing hard. Always print the cohort size. Prefer a simple "returned in week 2" measure before multi-month curves. If a cohort is still in the low tens of accounts, treat the line as directional rather than as a retention benchmark.
Friction counts that stay honest
Pick a single friction source for the board: fatal errors on the core path, setup abandonments, or a support tag that means "blocked." Changing the friction definition mid-quarter resets learning. Date any definition change.
What "core-active on core workflow" is not
It is not marketing email opens. It is not sessions that bounced from the marketing site. It is accounts that fired the core workflow event in the last seven days. If you cannot name the event, you do not have the metric yet.
Comparing to public SaaS benchmarks
Public benchmark blogs rarely match your ICP, price, or setup time. Prefer your own prior weeks as the baseline. If you cite an external benchmark in a memo, open the source the day you write and put the verification date in private editorial notes.
Funnel steps versus board tiles
A full funnel report can have eight steps. The founder board should still show only the activation rate and maybe a single mid-funnel drop that you are actively fixing. Detailed funnels belong in the working session with eng and design, not on the same page as the five decision numbers.
Experiment reads stay off the main board
Pricing tests, copy tests, and waitlist experiments need their own dated cards. Parking every experiment metric on the main dashboard recreates noise. Link out from the weekly note when an experiment is live; do not promote temporary metrics into permanent tiles.
Update ritual that keeps trust
Cadence | What happens |
|---|---|
After each meaningful release | Spot-check activation and friction for forty-eight hours |
Weekly | Refresh the five figures; write a short context line each |
Monthly | Revisit definitions; drop tiles nobody used in decisions |
Put a "last refreshed" timestamp on the page. If the stamp is stale, treat the board as unsafe for decisions until someone updates it.
Context lines
Beside each metric, leave one line for what changed. Example: "Activation dip after we moved the invite step." Without that line, every dip starts a blame loop.
Avoid vanity tiles
Total pageviews, raw registration counts without qualification, and social followers rarely belong on the shipping decision board. Put them on a marketing report if needed.
Event taxonomy hygiene
Prefix events by domain if multiple squads ship tracking: onboarding.*, billing.*, core.*. Publish the taxonomy next to the definition table. When two events mean the same human action, merge them in analysis rather than averaging confusion on the board.
QA accounts forever
Maintain a denylist of QA and employee accounts in the same place as the definitions. Refresh it when contractors join. A single load-test account can distort core-active counts on a small base.
Instrumentation checklist before you automate
- Event names written in the definition table
- Test account filter documented
- Time zone for "weekly" agreed
- Owner for broken tracking
- Manual backup count method if the pipe fails
Automate only after a pair of Monday reviews where nobody disputed the formulas. A wrong automated tile teaches the company the wrong story faster than a slow spreadsheet.
Color without drama
Order and timestamps beat traffic-light art. If you use colors, define thresholds next to tripwires in the same document.
Owner models
Model | Who updates product tiles | Risk |
|---|---|---|
Founder-led | Founder | Stops during fundraising crunch |
Product lead | Product lead | Needs access to analytics admin |
Shared | Founder defines, IC updates | Definitions drift without review |
Stay with a single ownership model for ninety days. Switching owners every other week recreates distrust.
Sharing rules
Share definitions with anyone who can ship shipping changes. Hide experimental charts that are still unstable. Ambiguous public charts train people to ignore all charts.
Common failure modes
- Renaming events without updating the definition table
- Activation that includes internal employees
- Retention curves with single-digit cohorts treated as law
- Building a second board for leadership with different formulas
- Adding a tile for every advisor question
Ninety-day check
After ninety days, ask which metrics changed a decision, which metrics nobody trusts, and which take longer to update than they are worth. Remove or redefine the weak ones. Startup metrics dashboard basics reward fewer, clearer numbers.
Building the first page in one afternoon
- Draft the five-row definition table
- Agree tripwires and the weekly read order
- Pull last week once by hand or from a trusted export
- Place numbers on a single page with the read order labeled
- Assign updaters and a weekly calendar block
If the afternoon ends without definitions, you do not have a dashboard yet. You have a sketch.
Legal note
Privacy, retention of user data, and analytics tooling contracts need counsel when you operate across regions. This post is operating guidance for internal product reviews, not legal advice.
Frequently asked questions
How many metrics belong on an early startup dashboard?
Five is enough for most early teams. Add a sixth only when it changed a decision twice and has a named updater. More tiles usually mean less trust.
What is activation on a startup metrics dashboard?
Activation is the event that means a new account got the job done, counted inside a fixed window such as seven days. Write the event name in the definition and print sample size beside the rate.
Should cash and burn sit on the same board as usage metrics?
Usually no. Keep money numbers on the finance review and usage numbers on the Monday usage board unless you are investigating a product-caused cash swing that week.
When should we automate the dashboard?
After definitions are trusted. If people still argue about formulas, automation will only spread the wrong story faster.
Sources
- YC essential startup advice. Checked on November 1, 2026.
- Nautis Startup Health help. Checked on November 1, 2026.
- Nautis Financial planner help. Checked on November 1, 2026.
- Nautis Sheets help. Checked on November 1, 2026.
Baltej Singh is a serial entrepreneur, technology leader, and Founder & CEO of Nautis and DemoVexa, with over 16 years of experience building software products, SaaS platforms, and startups. Previously the Co-Founder & CTO of SanchiConnect, he has worked extensively in the DeepTech startup ecosystem, connecting with 200+ venture capital firms and supporting a network of 4,000+ startups. Passionate about AI, automation, and entrepreneurship, he focuses on building innovative products that solve real-world problems and help businesses grow.