
How to track unit economics for a SaaS startup
 Baltej Singh8 min read
Unit economics for SaaS means knowing what one customer is worth after what you spent to win and serve them. Nautis does not ship a module named Unit Economics. Startup Health captures cash, recurring revenue (MRR), and burn for runway and trends. Financial Planner builds multi-year projections from your assumptions. You still own the CAC, LTV, payback, and churn definitions in a sheet or Note you review weekly. This is operating guidance. It is not accounting or fundraising advice.
Name owner, artifact, and weekly slot first
Unit economics for SaaS fails when the formulas live in a founder's head. Before you debate LTV math, write three lines:
- Owner: one named human.
- Artifact: one sheet or Note with dated inputs.
- Weekly slot: a fixed thirty minutes on the calendar.
Illustrative setup (composite only): Mira at Driftly owns the artifact every Monday 9:30. Nobody else edits formulas without her. Arguments happen in the meeting, not in five conflicting tabs.
If you skip the owner, every metric becomes optional. Optional metrics do not ship. Name a backup owner for vacation weeks. The backup may update inputs and run the slot; they may not change definitions mid-quarter without a dated changelog line.
Store the artifact where the company already works. A sheet that only lives on one laptop will vanish during diligence. Share read access with the CEO and finance lead; keep edit access narrow.
Define the four numbers in plain language
Keep definitions boring and stable for a quarter.
CAC: sales and marketing spend in a period divided by new customers won in that period. Say what spend counts. Illustrative Driftly rule (composite only): paid ads, SDR tools, and sales salaries in; brand conference booths out until they can attribute.
LTV: average revenue per account times gross margin contribution you are willing to claim, times expected lifetime in months. If you lack margin data, start with contribution that is clearly after hosting and support variable cost, and label the assumption.
Payback: CAC divided by monthly contribution profit per customer. Months until you recover CAC.
Churn: customers or revenue lost in the period divided by starting base. Pick logo or revenue churn and stick to it for the quarter.
Unit economics for SaaS that redefine CAC every week cannot show learning. Freeze definitions; change inputs. Write the freeze date at the top of the artifact. After the quarter, schedule a definition review on purpose, not during a panic Monday.
Avoid vanity ARPU spikes from one custom enterprise deal when you sell mostly self-serve. Segment or exclude the outlier with a note. Mixed whales and small logos will lie about payback.
Illustrative definition card (composite only): "Period = calendar month. New customer = first paid invoice in month. CAC spend = ads + SDR software + sales payroll. Logo churn = lost paying accounts / starting paying accounts." Paste that card above the numbers every week.
Single-variable board (change one thing per phase)
Run the practice as experiments, not as a dashboard museum. Each phase, change one major variable only.
Phase (illustrative) | Variable you may change | Freeze everything else | Review question |
|---|---|---|---|
Weeks 1-2 | CAC spend mix | Pricing, support load | Did CAC fall without killing pipeline quality |
Weeks 3-4 | Onboarding completion rate | Ad spend | Did payback shorten via faster time-to-value |
Weeks 5-6 | Price or packaging on new logos only | Old contracts | Did LTV rise without logo churn spike |
Weeks 7-8 | Support hours per account | Pricing | Did contribution margin improve |
Illustrative miss (composite only): Driftly cut ads, raised prices, and removed a success manager in the same week. Metrics moved; nobody knew why. Single-variable discipline would have isolated the cause.
If a phase fails, reverse or hold. Do not stack a second variable to fix the chart. Unit economics for SaaS learning dies when every bad week rewrites both the dictionary and three levers.
Write the active variable in the calendar invite title. People show up knowing what is in bounds. Scope creep is how Monday becomes a strategy offsite.
Wire MRR and burn without fake precision
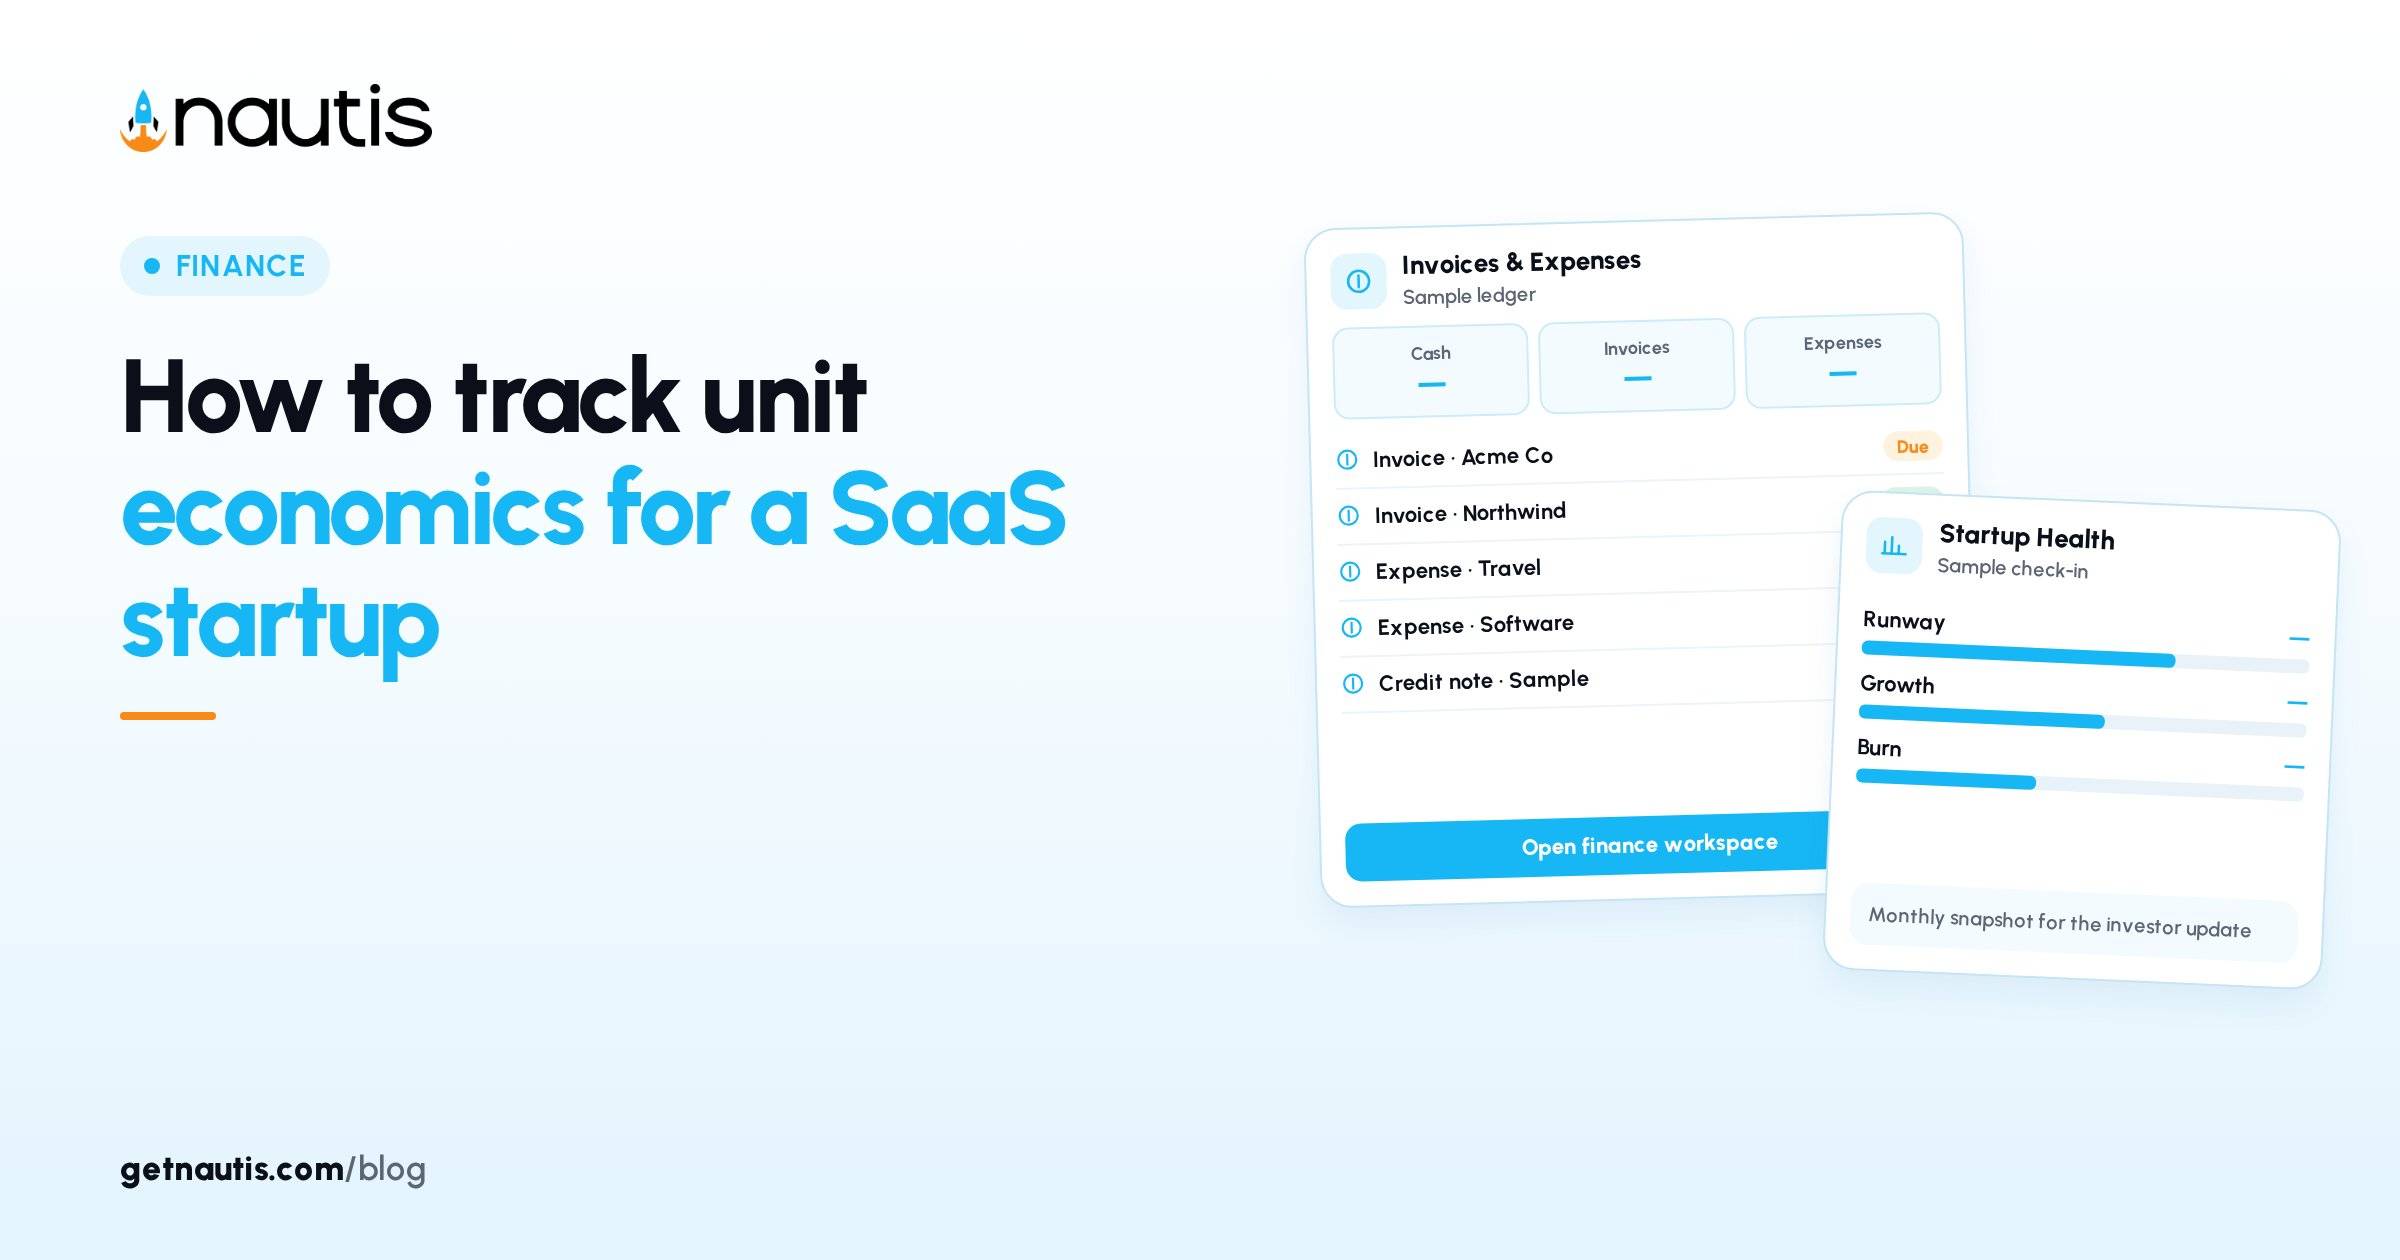
In Startup Health, a monthly check-in captures cash, recurring revenue, and burn. Enter MRR as recurring revenue only (skip one-off sales). Enter Monthly Burn as total spend minus revenue, or 0 if cashflow positive. That feeds runway and burn-trend metrics. Use those as the company pulse. Do not pretend Startup Health calculated your LTV.
Put CAC, LTV, payback, and churn in the owner artifact. Each Monday, copy the latest MRR and burn from the check-in into the artifact as context. Unit economics for SaaS sit beside runway, not inside a hidden cell nobody trusts.
When you need projection scenarios (slower hiring, delayed round, CAC shifts), Financial Planner is where assumptions become multi-year statements. Enter scenario levers there; keep the weekly unit sheet thinner.
For burn and runway labels, see How to calculate startup burn rate and runway. For choosing where planning tools live, see Best startup financial planning tools for founders.
Cash in the bank is not LTV. Sent invoices are not CAC recovery. Keep customer billing status in Invoices; keep unit math in the artifact; keep the pulse in Startup Health.
Illustrative eight-week Driftly run
Illustrative Driftly (composite only): Week 1: freeze definitions; baseline CAC 1,200, payback 14 months, monthly logo churn 3%. Week 2: single variable = cut one low-quality ad channel; CAC to 1,050; pipeline quality watched. Week 3-4: freeze spend mix; improve onboarding checklist completion; payback to 11 months. Week 5: test a higher annual plan for new logos only; LTV assumption up; watch churn of new cohort separately. Week 6: no new changes; verify data. Week 7-8: reduce reactive support tickets with a docs fix; contribution per account up slightly; still one variable.
They never edited three levers the same Monday. The artifact shows a dated changelog. Investors get a snapshot from Startup Health for cash and MRR; the unit sheet stays internal until definitions survive a month.
Tie sales compensation to the same CAC definition the sheet uses. If SDRs are paid on meetings while CAC counts only closed logos, the Monday review will argue forever. Align the definition once in writing.
Illustrative changelog line (composite only): "2026-06-12 phase 2 start: onboarding checklist required before week-two QBR; ad mix frozen." Future you will need that line.
Unit economics for SaaS: thirty-minute review
Minute 0-5: paste MRR, burn, cash context. Minute 5-15: CAC, LTV, payback, churn versus last week; only discuss the active phase variable. Minute 15-25: decide keep, reverse, or extend the experiment; write the next phase variable or hold. Minute 25-30: assign one cleanup (attribution tag, refund coding, cohort date fix).
Unit economics for SaaS meetings that reopen every definition each week are therapy, not control. Parking-lot new formula ideas for month-end.
If payback is longer than your cash runway can tolerate, the constraint is cash, not clever packaging. Shorten payback or raise cash; do not hide the math.
When churn spikes, resist changing LTV lifetime downward and CAC definitions upward in the same hour. Pick the variable your phase already named.
End the meeting with a spoken recap: active variable, decision, owner of the cleanup. If nobody can repeat it, the meeting failed even if the sheet looks tidy.
Cohort hygiene without a research project
You do not need a data team to keep cohorts honest. Tag each new logo with start month and acquisition channel in the artifact. When you change price for new logos only, report churn and LTV for that cohort apart from the legacy base. Unit economics for SaaS blur when legacy discounts and new list prices share one blended LTV cell.
Illustrative cohort note (composite only): "2026-05 new annual plan logos: n=14; early logo churn 0 after 45 days; do not update company-wide LTV until n=40 or 90 days." Patience is part of the method.
Refunds and credits belong in the period they hit cash or MRR, with a one-line note. Silent deletes of churned logos are how payback looks better than reality.
Keep diligence honest
When someone asks for unit economics for SaaS in a raise, show definitions dated, the changelog of single-variable phases, and the current four numbers. Do not invent LTV with unbounded retention. Label cohort math as illustrative until you have real retention curves.
Illustrative diligence answer (composite only): "CAC is paid plus SDR cost over new logos; LTV uses 0.75 contribution and 30-month lifetime until we have 12 months of cohort data; payback is 11 months; logo churn 2.4%. We change one lever per two-week phase; changelog is in the sheet." That sentence beats a beautiful dashboard with silent formula edits.
Gross margin for product startups is a sibling topic with its own rigor. Do not jam full COGS redesign into the same Monday slot as CAC experiments. Sequence them.
Unit economics for SaaS are done when the owner can open the artifact cold and recite definitions, the active variable, and last week's four numbers without a Slack ping. Startup Health and Financial Planner support the company pulse and scenarios. Your weekly sheet carries CAC, LTV, payback, and churn.
Frequently asked questions
Does Nautis have a Unit Economics module?
No. Startup Health tracks cash, MRR, and burn. Financial Planner handles projections. You maintain CAC, LTV, payback, and churn in your own artifact.
What should we freeze versus change?
Freeze definitions for a quarter. Change one major operating variable per phase, such as spend mix or onboarding completion.
How does this relate to Startup Health?
Monthly check-ins capture cash, recurring revenue, and burn for runway and trends. Copy MRR and burn into your unit sheet as context; do not expect Startup Health to compute LTV.
How long should the weekly review be?
Thirty minutes is enough if definitions are frozen and only the active phase variable is up for debate.
Sources
- Nautis Startup Health help. Checked on October 31, 2026.
- Nautis Financial Planner help. Checked on October 31, 2026.
- How to calculate startup burn rate and runway. Checked on October 31, 2026.
Baltej Singh is a serial entrepreneur, technology leader, and Founder & CEO of Nautis and DemoVexa, with over 16 years of experience building software products, SaaS platforms, and startups. Previously the Co-Founder & CTO of SanchiConnect, he has worked extensively in the DeepTech startup ecosystem, connecting with 200+ venture capital firms and supporting a network of 4,000+ startups. Passionate about AI, automation, and entrepreneurship, he focuses on building innovative products that solve real-world problems and help businesses grow.