
A 13-week cash flow forecast template for startups
 Baltej Singh8 min read
A 13-week cash flow forecast is a week-by-week table of the cash you expect to receive and pay out over the next quarter, ending each week with a projected bank balance. It is built from dates, not categories: when a customer will actually pay, when payroll leaves the account, when the annual software renewal hits. For a startup, its main job is to show the first week the balance would fall below the minimum you are willing to hold, early enough to do something about it.
A monthly budget or a multi-year financial model answers different questions. A budget says what you plan to spend this month. A projection says where the business could be in three years. Neither tells you that payroll and a large renewal land in the same week while your biggest customer pays ten days late.
This post gives you the template row by row, shows a filled-in example for the first six weeks, and explains how to keep it current in about 30 minutes each Monday.
What a 13-week cash flow forecast shows that a budget does not
Thirteen weeks is one quarter. That is long enough to see the next two or three payroll cycles, quarterly bills and any annual renewals, and short enough that most numbers come from real invoices and contracts rather than guesses.
The differences from a budget are practical:
Question | Monthly budget | 13-week cash flow forecast |
|---|---|---|
Time unit | Month | Week |
Revenue line | Revenue earned or expected | Cash you expect to collect that week |
Costs | Grouped by category | Placed on the date the money leaves |
Main output | Spend against plan | Closing bank balance each week |
Typical use | Planning and reviewing spend | Spotting a cash shortfall weeks ahead |
Update rhythm | Monthly | Weekly, rolling forward |
Profit and cash also move on different clocks. A signed deal can look great on paper and still not pay for 45 days. If that gap is new to you, read cash flow vs profit for startups first.
The template, row by row
Set up one spreadsheet tab. Put the weeks across the top as columns, labeled with the Monday each week starts, and the cash lines down the side as rows. Use these rows in this order:
- Opening cash. The bank balance at the start of the week. For week 1, use the actual balance across all business accounts. For every later week, it equals the previous week's closing cash.
- Receipts. One row per source of incoming cash: customer payments, refunds you are owed, a loan or investment that is signed and scheduled to arrive. Keep large customers on their own rows.
- Total receipts. The sum of the receipt rows.
- Payments. One row per type of outgoing cash: payroll, contractors, rent, software, insurance, loan repayments, other. Put any single payment above a threshold you choose on its own row so it stays visible.
- Total payments. The sum of the payment rows.
- Net cash flow. Total receipts minus total payments.
- Closing cash. Opening cash plus net cash flow.
- Minimum cash floor. A fixed number you decide in advance, such as two months of payroll. This row does not change week to week.
- Headroom. Closing cash minus the floor. Format negative values in red.
Keep a separate notes column or tab for assumptions, such as "Customer A pays 15 days after invoice, based on the last four invoices." When a number turns out wrong, the note tells you which assumption to fix.
Filling in receipts from invoices and contracts
Receipts are where most forecasts go wrong, because it is tempting to enter the date the invoice is due rather than the date the money usually arrives.
Work through sources in this order:
- Open invoices. List every unpaid invoice. For each, estimate the week payment will land based on how that customer has actually paid before, not the due date. A customer who pays 20 days late every time should be forecast 20 days late.
- Recurring billing. Monthly or annual subscriptions that bill automatically go in the week the payment processor pays out to your bank, which may be a few days after the charge.
- Signed but not yet invoiced. Contracts with a clear invoice date. Add them in the week you expect payment, after your usual delay.
- Pipeline deals. Leave unsigned deals out of the base forecast. If you want to see them, add a separate row below closing cash labeled as upside so they never inflate the main balance.
If late payers are a pattern, the post on managing accounts receivable early covers how to chase them.
Filling in payments by date, not by category
Payments are easier to predict because most of them are on a schedule you control. The work is placing each one in the correct week.
- Payroll. Enter the gross cash that leaves the account on each pay date, including employer costs your payroll provider debits. If you pay every two weeks, it lands in every other column.
- Rent and fixed bills. Put them in the week of the due date.
- Software. Monthly tools go in the week they renew. Annual renewals are easy to forget, so pull them from your card statements for the last 12 months.
- Contractors. Use the payment terms in each agreement, not the date work is done.
- Quarterly and annual items. Insurance renewals, estimated tax payments your accountant has scheduled, and annual subscriptions often cause the biggest single-week drops. Ask your accountant for the dates rather than guessing.
- Other. Keep a small weekly allowance for travel and one-off purchases, based on recent weeks.
A filled-in example for weeks 1 to 6
Here is how the template looks for an example company. Harbor Labs is a fictional seven-person software startup; every figure below is an illustration, not a benchmark.
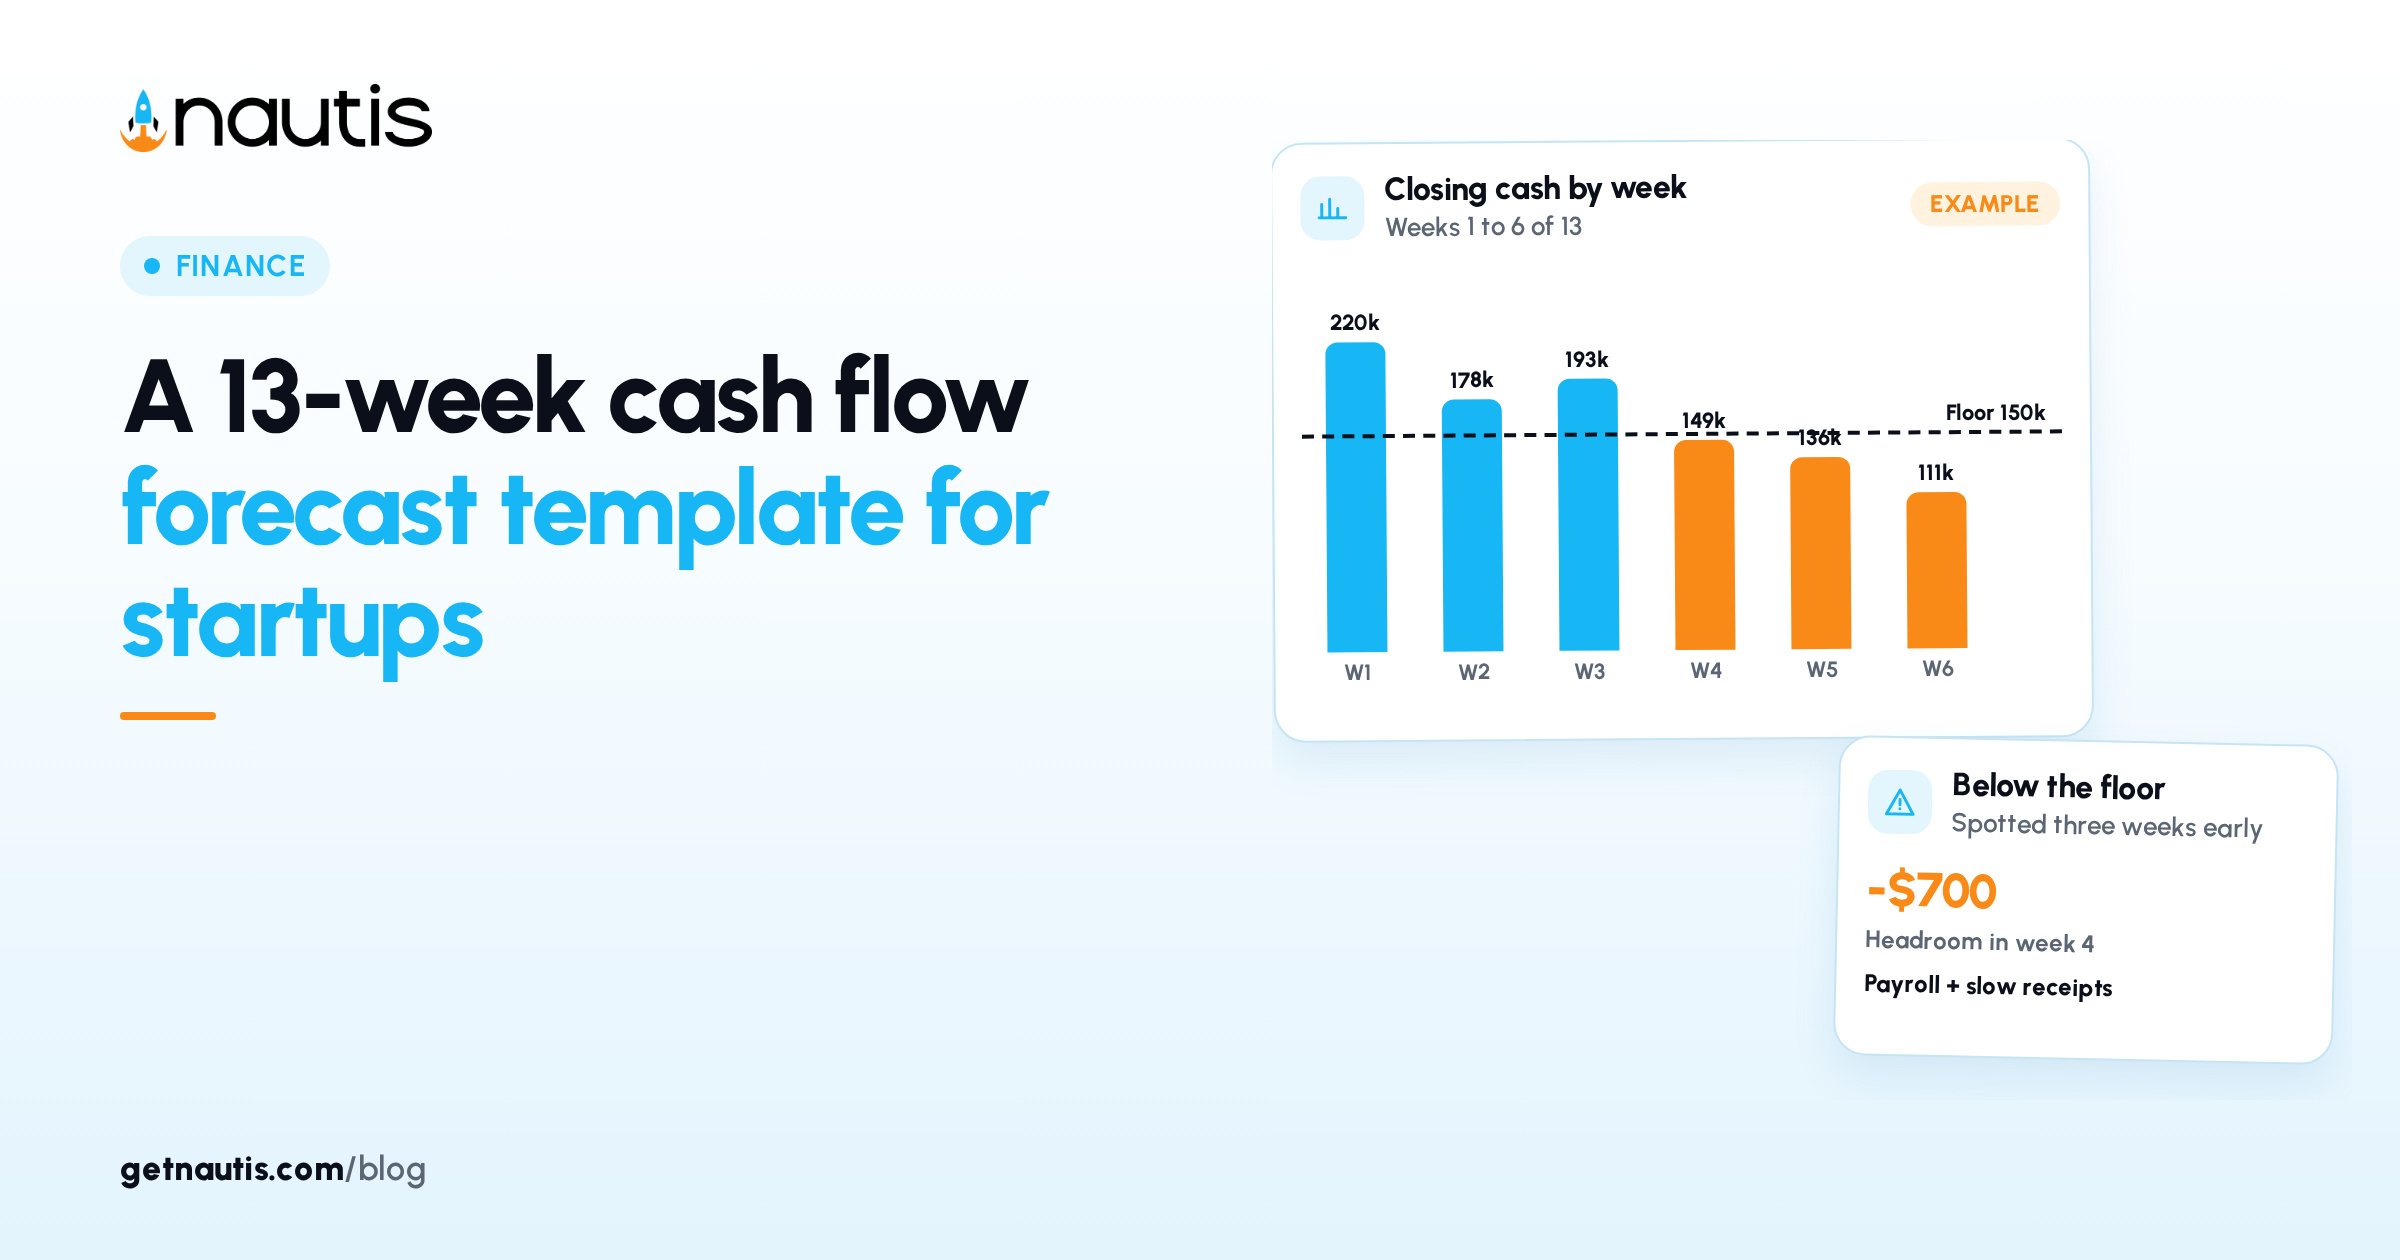
Harbor Labs starts with $212,000 in the bank and sets a minimum cash floor of $150,000. Payroll of $46,000 leaves every two weeks. An annual insurance renewal of $12,500 falls in week 5, inside the "Other" row.
Row | Week 1 | Week 2 | Week 3 | Week 4 | Week 5 | Week 6 |
|---|---|---|---|---|---|---|
Opening cash | 212,000 | 219,800 | 178,300 | 192,800 | 149,300 | 135,600 |
Customer receipts | 18,000 | 6,000 | 24,000 | 4,000 | 9,000 | 31,000 |
Payroll | 0 | 46,000 | 0 | 46,000 | 0 | 46,000 |
Rent | 5,500 | 0 | 0 | 0 | 5,500 | 0 |
Software | 3,200 | 0 | 0 | 0 | 3,200 | 0 |
Contractors | 0 | 0 | 8,000 | 0 | 0 | 8,000 |
Other | 1,500 | 1,500 | 1,500 | 1,500 | 14,000 | 1,500 |
Total payments | 10,200 | 47,500 | 9,500 | 47,500 | 22,700 | 55,500 |
Net cash flow | 7,800 | -41,500 | 14,500 | -43,500 | -13,700 | -24,500 |
Closing cash | 219,800 | 178,300 | 192,800 | 149,300 | 135,600 | 111,100 |
Headroom over floor | 69,800 | 28,300 | 42,800 | -700 | -14,400 | -38,900 |
Read the bottom row first. Harbor Labs drops below its floor in week 4 and stays below it after that. Nothing in a monthly budget would have flagged week 4 specifically, because the month as a whole looked roughly on plan.
Seeing this in week 1 gives the founders three weeks to act. Realistic options include asking the week 6 customer to pay earlier in exchange for a small discount, moving the contractor payment to the end of the agreed terms, asking the insurer about monthly installments, or holding off on a planned hire. For the longer view of how many months of cash remain, see how to calculate startup burn rate and runway.
Updating the forecast every Monday
A 13-week forecast is only useful if it rolls forward. Block 30 minutes at the same time each week and follow the same steps:
- Enter actuals for last week. Replace the forecast numbers in the column that just ended with what actually came in and went out.
- Compare forecast with actual. Note any line that missed by more than an amount you set in advance. Write one line on why.
- Fix the assumption, not just the number. If a customer paid late again, move their future receipts later too.
- Drop the old week and add a new week 13. The forecast always looks 13 weeks ahead.
- Check the headroom row. If any week is below the floor, decide who will act and by when, and write it down.
After a month of updates, the forecast-against-actual notes become the most useful part of the sheet. They show which customers pay late, which costs creep and how far off your first guesses were.
Building it in Nautis Sheets
You can build this in any spreadsheet tool. If your team uses Nautis, the help center describes these pieces:
- Sheets is a built-in spreadsheet editor with standard formulas. You can import an existing .xlsx, .xls or .csv file, or pull one in from Google Sheets, and share it with teammates or by a password-protected link. Cell-anchored comments let a co-founder question a specific number.
- Invoices shows each invoice's balance due, flags past-due ones with an Overdue badge and includes an aging analysis, which is a quick source for the receipts rows. Payments are collected outside Nautis and recorded manually, so the status is only as current as your records.
- Expenses supports recurring expenses with a start date and frequency, which helps you list the regular payments.
- Financial Planner builds 3-year or 5-year projections with burn rate and runway on its dashboard. Use it for the long-range model and keep the weekly 13-week cash flow forecast in a sheet next to it.
Nautis is not an accounting system, so your bank balance and books stay the source of truth. If your cash position is tight, review the forecast with your accountant or a fractional finance lead before making commitments based on it.
Frequently asked questions
What is a 13-week cash flow forecast?
It is a spreadsheet that shows the cash a business expects to receive and pay out in each of the next 13 weeks. Each week starts with an opening balance and ends with a projected closing balance. Its main use is spotting the week cash would drop below a safe level.
Why use 13 weeks instead of a monthly forecast?
Thirteen weeks covers a full quarter, including several payroll cycles and quarterly bills, while staying close enough that most numbers come from real invoices and contracts. Weekly columns also show timing problems that a monthly total hides, such as payroll and a large renewal landing in the same week.
Should pipeline deals go into a 13-week cash flow forecast?
Leave unsigned deals out of the main forecast. If you want to see them, add a separate upside row below closing cash so they never raise the main balance. Signed contracts can go in once you know when they will be invoiced and paid.
How often should a startup update its cash flow forecast?
Update it once a week, at the same time each week. Replace last week's forecast with actual figures, note any big misses and why, adjust future weeks to match, and add a new week at the end so the view always covers 13 weeks.
Sources
- Nautis Help Center, Sheets. Checked on November 15, 2026.
- Nautis Help Center, Invoices. Checked on November 15, 2026.
- Nautis Help Center, Expenses. Checked on November 15, 2026.
- Nautis Help Center, Financial Planner. Checked on November 15, 2026.
Baltej Singh is a serial entrepreneur, technology leader, and Founder & CEO of Nautis and DemoVexa, with over 16 years of experience building software products, SaaS platforms, and startups. Previously the Co-Founder & CTO of SanchiConnect, he has worked extensively in the DeepTech startup ecosystem, connecting with 200+ venture capital firms and supporting a network of 4,000+ startups. Passionate about AI, automation, and entrepreneurship, he focuses on building innovative products that solve real-world problems and help businesses grow.